[해외주식] MVIS 주간지, 강세 교차 전망 / MVIS Weekly looking to cross Bullish
 주식개미
0
2207
2021.06.03 14:03
MicroVision, Inc
StofAxeCapital
Not an Advisor.
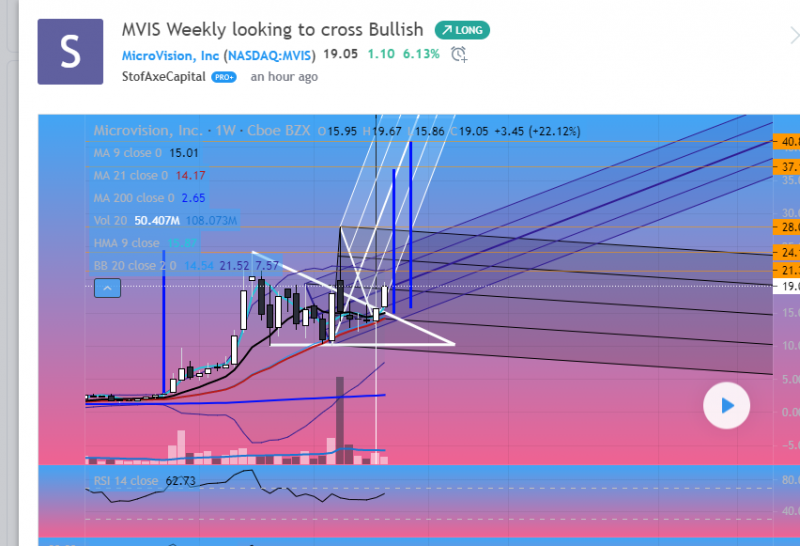
This chart is a bit messy so I apologize in advance. Weekly Chart for MVIS is showing monster potential.
Looking to cross bullish on the MACD
Stoch lines are looking like they may start that movement upward signaling strength to come to this chart.
RSI is only at 62! Plenty of room to run here.
Still awaiting on Volume to match the weekly average of just a bit over 100 million, currently at half of that with 2 days left this week of trading.
Watching this closely to see what pitchforks further get validated with price action this week.
Blue lines are flag measurements to gather price targets.
Gold lines are areas of previous resistance/ support. Also price targets.
번역:
마이크로비전
스토팩스 수도
어드바이저가 아닙니다.
이 차트는 좀 지저분해서 미리 사과드립니다. MVIS 주간 차트에 몬스터 잠재력이 표시되어 있습니다.
MACD의 교차 강세 분석
확률선은 이 차트에 오르기 위해 상향 신호 강도를 시작할 수 있는 것처럼 보입니다.
RSI는 겨우 62살이야! 여기서 달릴 수 있는 공간이 충분합니다.
여전히 주간 평균인 1억을 조금 넘어서기 위해 볼륨에서 대기하고 있으며, 현재 이 중 절반인 이번 주 거래일이 이틀 남았습니다.
이번 주 가격 결정으로 어떤 피치포크가 더 검증되는지 자세히 살펴보십시오.
파란색 선은 가격 목표를 수집하기 위한 플래그 측정입니다.
금색 선은 이전의 저항/지지 영역입니다. 가격 목표도 있습니다.
원문링크: https://www.tradingview.com/chart/MVIS/G9V8DIl0-MVIS-Weekly-looking-to-cross-Bullish/
[본문뒤 추가문구] 서학개미 투자포럼 - 해외투자 트렌드의 중심


