[해외주식] #SNDL - 매주 강도와 반전 징후 표시 / #SNDL - Weekly showing strenght and r…
 주식개미
0
2323
2021.05.26 17:10
SUNDIAL GROWERS INC
BehindTheTrade
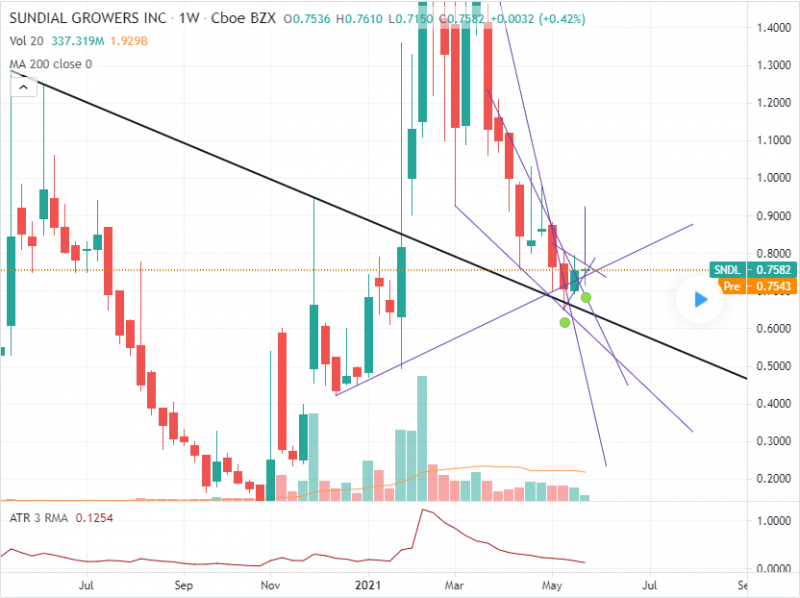
If we look at the weekly chart, I identified two main reasons why I consider 0.7$ being the bottom and why I think there are good chances that we can see higher levels soon:
1- Previous week candle was a piercing line candlestick pattern, with the opening below the previous candle close and with the close above the mid-body of the previous week
2- The price is reacting strongly with high volumes at the 0.72$ level, which is where most of the institutionals have their average purchasing price
In addition to this, just to estimate where the price might go by the end of this week, let's have a look at the average true range of the last 3-weeks: the price had an average extension from low to high of approximately 0.13$. This means that, starting from the assumption that the week will be a positive one, and having the low of the current week at 0.715$, this means that the price might "potentially" extend its movement up to 0.845$. This is pretty realistic and we of course hope that this will be just the beginning of the trend reversal.
Also, in the H1 chart, the head and shulder pattern that I shared few days ago, is going to complete its formation attacking the 0.795$ resistance level soon.
번역:
선다이얼 재배자 주식회사
거래의 배경
주간 차트를 살펴보면, 0.7$를 최하위로 보는 이유와 더 높은 수준을 곧 볼 수 있는 좋은 기회가 있다고 생각하는 이유 두 가지를 알아냈습니다.
1- 전 주 초는 전 주 초보다 아래가 닫히고, 전 주 중체보다 위가 닫히는 피어싱 라인 촛대 패턴이었다.
2-가격은 0.72$ 수준에서 대량으로 반응하고 있으며, 대부분의 기관이 평균 구매 가격을 가지고 있다.
또한 이번 주말까지 가격이 어디로 갈지 예측하기 위해 지난 3주 동안의 평균 실제 범위를 살펴보겠습니다. 가격은 낮은 수준에서 높은 0.13달러로 평균 연장되었습니다. 이는 한 주가 긍정적인 주가 될 것이라는 가정에서부터 시작하여 현재 주의 최저가 0.715달러로, 이는 가격이 "잠재적으로" 0.845달러까지 확대될 수 있다는 것을 의미한다. 이것은 꽤 현실적이고 우리는 물론 이것이 단지 추세 반전의 시작에 불과하기를 바란다.
또한 H1 차트에서는 며칠 전에 공유했던 머리와 어깨 패턴이 곧 0.795$ 저항 레벨을 공격하는 구성을 완료할 예정입니다.
원문링크: https://www.tradingview.com/chart/SNDL/fwc0xT3k-SNDL-Weekly-showing-strenght-and-reversal-signs/
[본문뒤 추가문구] 서학개미 투자포럼 - 해외투자 트렌드의 중심


