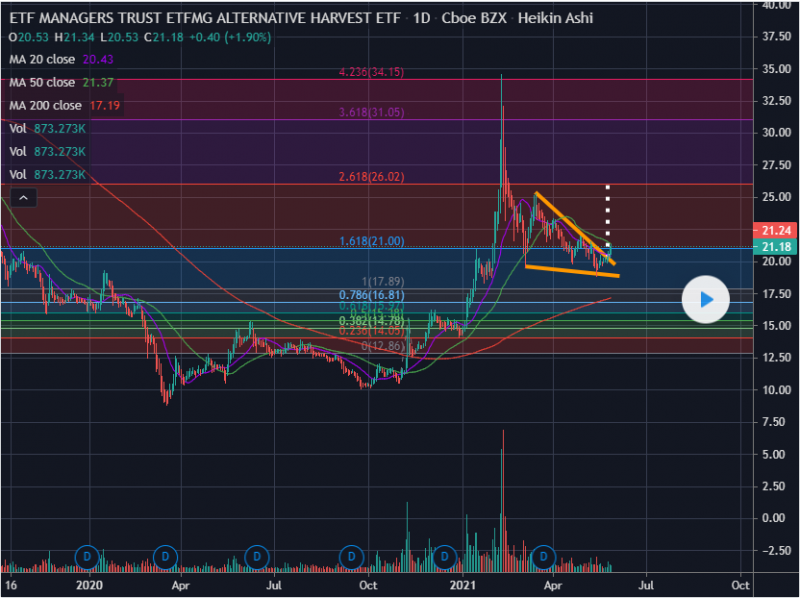
[해외주식] $MJ - 하강 웨지 브레이크아웃. 목표 $26 / $MJ - Descending wedge breakout. T…
 주식개미
0
2360
2021.05.28 11:31
ETF MANAGERS TRUST ETFMG ALTERNATIVE HARVEST ETF
PaperBozz
Breaking out from Descending wedge .
Target - $26
———————————————————
How to read my charts?
- Matching color trend lines shows the pattern. Sometimes a chart can have multiple patterns. Each pattern will have matching color trend lines .
- The yellow horizontal lines shows support and resistance areas.
- Fib lines also shows support and resistance areas.
- The dotted white lines shows price projection for breakout or breakdown target.
Disclaimer: Do your own DD. Not an investment advice.
번역:
ETF 관리자들은 ETFMG 대체 수확 ETF를 신뢰한다.
페이퍼보즈
하강 웨지에서 탈출합니다.
목표 - $26
———————————————————
차트 읽는 법?
- 컬러트렌드라인 매칭으로 패턴을 보여줍니다. 차트에는 여러 가지 패턴이 있을 수 있습니다. 각 패턴에는 일치하는 색상 추세선이 있습니다.
- 노란색 수평선에는 지지대 및 저항 영역이 표시됩니다.
- 피브라인에는 지지대 및 저항 영역도 표시됩니다.
- 흰색 점선은 브레이크아웃 또는 고장 대상에 대한 가격 예상치를 나타냅니다.
거부권: DD를 직접 수행합니다. 투자 조언이 아닙니다.
원문링크: https://www.tradingview.com/chart/MJ/hDqOcRG3-MJ-Descending-wedge-breakout-Target-26/
[본문뒤 추가문구] 서학개미 투자포럼 - 해외투자 트렌드의 중심


