[해외주식] NIO 상황 분석 / NIO analysis of the situation
 주식개미
0
2009
2021.07.28 17:55
NIO Inc
PtahaSP
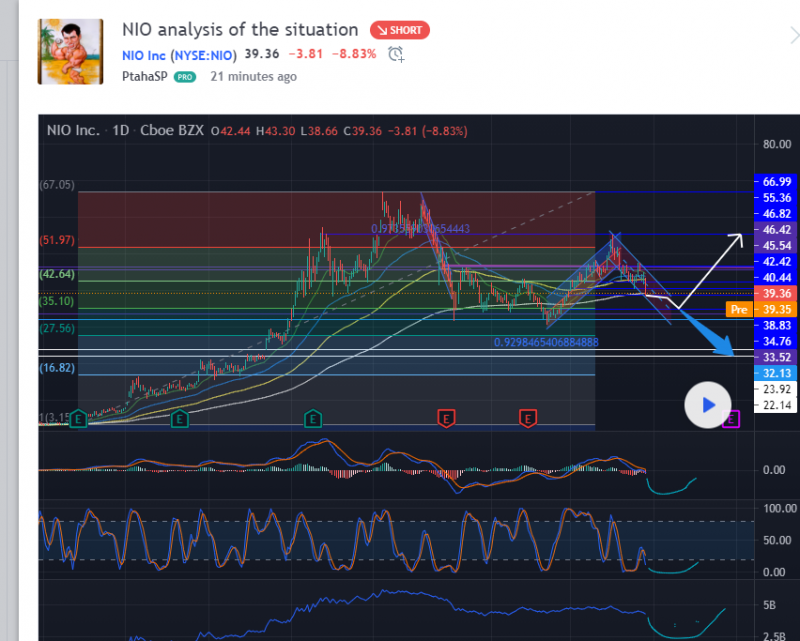
The daily chart with the RSI MACD OBV indicators shows the following picture: downfall to the support at 33.6 and its test, and if everything is OK, let's go to the resistance at 55. The Fibonacci levels also show a correction to 0.5 (35.10). And the worst case scenario is to close the gap at 22.14 This is just my assumption and is not an investment idea. If you have your own thoughts on this, I would be happy to hear a reasoned response. Good trading and profits to all.
번역:
NIO Inc
프타하SP
RSI MACD OBV 지표가 있는 일별 차트에는 33.6의 지원 감소와 테스트 결과가 나와 있습니다. 문제가 없으면 55의 저항으로 이동하겠습니다. 또한 피보나치 수준에서는 0.5(35.10)에 대한 보정이 표시됩니다. 최악의 시나리오는 22.14로 격차를 좁히는 것이지 투자 아이디어가 아니다. 이 문제에 대한 당신의 생각이 있다면, 저는 합리적인 답변을 들을 수 있다면 기쁠 것 같습니다. 모두에게 좋은 거래와 이익.
원문링크: https://www.tradingview.com/chart/NIO/g0UDioH7-NIO-analysis-of-the-situation/
[본문뒤 추가문구] 서학개미 투자포럼 - 해외투자 트렌드의 중심


