[코인] 5월 6일 BTCUSD 기준 차트 분석 / May 6 BTCUSD Bybit Chart Analysis
 코인개미
0
2431
2021.05.06 09:26
Bitcoin / U.S. Dollar
BitCoinGuide
Hello,
“Make it simple, make profit”
It’s BitcoinGuide.
Don’t forget to
“Follow” me and press “Likes”.
If you "follow" press,
Only 30 Min chart ,
In real time, you can check major sections and move,
Real-time "update I dea" can be checked.
I will begin BTCUSD Bybit Bitcoin Chart Analysis for May 6th .
This is the analysis on May 4th.
Please press the replay button.
Sky blue finger movement path,
56042 Short -> 53395.5 Long switching.
Out of profits up to $4100.
It's the old way.
This is the May 5th analysis.
For simplicity, I only proceeded with the movement route.
reached the target at the top,
Which method do you like?
4 hours chart.
Currently, it is a danger zone.
Ichimoku , the red cloud is very thin.
Based on the red parallel line
Rise and fall,
I've shown you the approximate movement and price.
Ignoring sideways,
Separated from the big trend.
Focusing on this part,
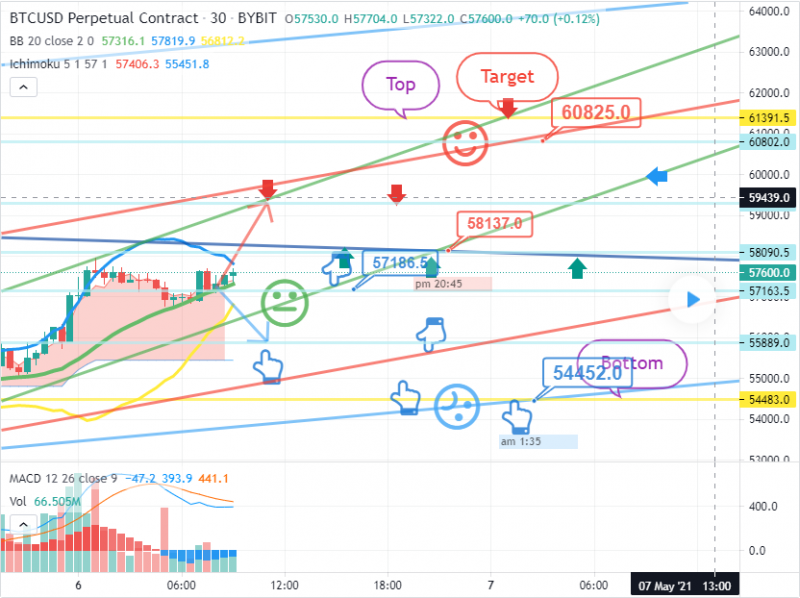
I created today's trading strategy.
This is a 30-minute chart long position strategy.
Green support line / strong rise
Red support line / sideways
*Red arrow on the path of movement
Long position strategy.
Stop loss when the green support line is deviated
Please check the target price at the top.
*At the time of the sky blue finger movement path
Short -> Short -> Long switching strategy.
When entering the first short,
Blue resistance line stop loss
If there is a rebound from the red support line,
Sideway move.
In the final bottom section,
This is a long position switching strategy.
I’ll finish today’s analysis, I think I will be away.
moving tomorrow. And I can't connect to the PC.
So, I'll take a weekend break and see you on Monday.
Thank you.
번역:
비트코인/미국 달러
비트코인 가이드
안녕
"간단하게, 수익을 창출하십시오."
비트코인 가이드입니다.
잊지 마세요
"팔로우"하고 "좋아요"를 누르세요.
"팔로우"를 누르면
단 30분 차트,
실시간으로 주요 부분을 확인하고 이동할 수 있습니다.
실시간 "업데이트 IDEA"를 확인할 수 있습니다.
5월 6일부터 BTCUSD Bybit 비트코인 차트 분석을 시작하겠습니다.
5월 4일 분석입니다.
재생 버튼을 누르세요.
하늘색 손가락 이동 경로,
56042 단락 -> 53395.5 긴 스위칭
이익에서 4100달러까지.
옛날 방식이에요.
5월 5일 분석입니다.
간단하게 이동 경로만 진행했습니다.
상단의 목표에 도달했고
당신은 어떤 방법을 좋아합니까?
4시간 차트.
현재 이곳은 위험 지역입니다.
이치모쿠, 빨간 구름은 매우 얇아요.
빨간색 평행선 기준
오르락내리락,
대략적인 움직임과 가격을 보여드렸습니다.
곁눈질로 무시하면
대세와는 별개로.
이 부분을 중심으로 해서.
오늘의 무역 전략을 수립했습니다.
이것은 30분짜리 차트 롱 포지션 전략입니다.
녹색 지지선/강세 상승
빨간색 지지선/측면
*이동 경로의 빨간색 화살표
롱 포지션 전략.
녹색 지원 라인이 이탈된 경우 손실 중지
상단의 목표 가격을 확인해 주세요.
*하늘색손가락이동경로시
Short -> Short -> Long Switching Strategy
첫 번째 단락을 입력할 때
파란색 저항 라인 정지 손실
빨간색 지지선에서 반동이 발생하면
옆으로 비켜라.
마지막 하단 부분에서
이것은 긴 위치 전환 전략입니다.
오늘 분석을 마치겠습니다, 자리를 비울 것 같습니다.
내일 이사한다. 그리고 PC에 연결할 수 없습니다.
그래서 주말에 쉬고 월요일에 보자.
감사합니다.
원문링크: https://www.tradingview.com/chart/BTCUSD/OZv1cOs1-May-6-BTCUSD-Bybit-Chart-Analysis/
서학개미 투자포럼 - 해외투자 트렌드의 중심


